 Help
Help
The European Commission has finally released the new edition of the eagerly awaited She Figures 2015 report. This publication is the fifth edition of the She Figures series –released every three years since 2003– which aims to monitor the level of progress made towards gender equality in research and innovation in the European Union. It analyzes comparable statistics on women and men amongst PhD graduates, researchers and decision-makers, and data on differences in working conditions. Additionally, new areas such as patent applications and scientific publications are considered for the first time. In this post we want to briefly highlight the main findings of the report.
Regarding the pool of higher education graduates at doctoral level (Chapter 2 of the report), more women reached that educational level: in 2012, they made up 47% of PhD graduates in the EU-28, and between 40% and 60% of PhD graduates in all countries covered by the report. But there are marked gender differences by subjects: for example, in 2012 women accounted for just 28% of PhD graduates in engineering, manufacturing and construction, and only 21% of those graduating from computing (18% in 2004).
Looking at the labour market of the EU-28, the number of women in science and technology occupations grew at a faster rate than the number of men, between 2008 and 2013. However, women were still less than half (40%) of those who are employed as scientists and engineers (as Figure 3.1 from Chapter 3 shows). Besides, gender segregation persists among these professionals: for example, women are under-represented –relative to men– in manufacturing enterprises, with few exceptions such as pharmaceutical manufacturing.

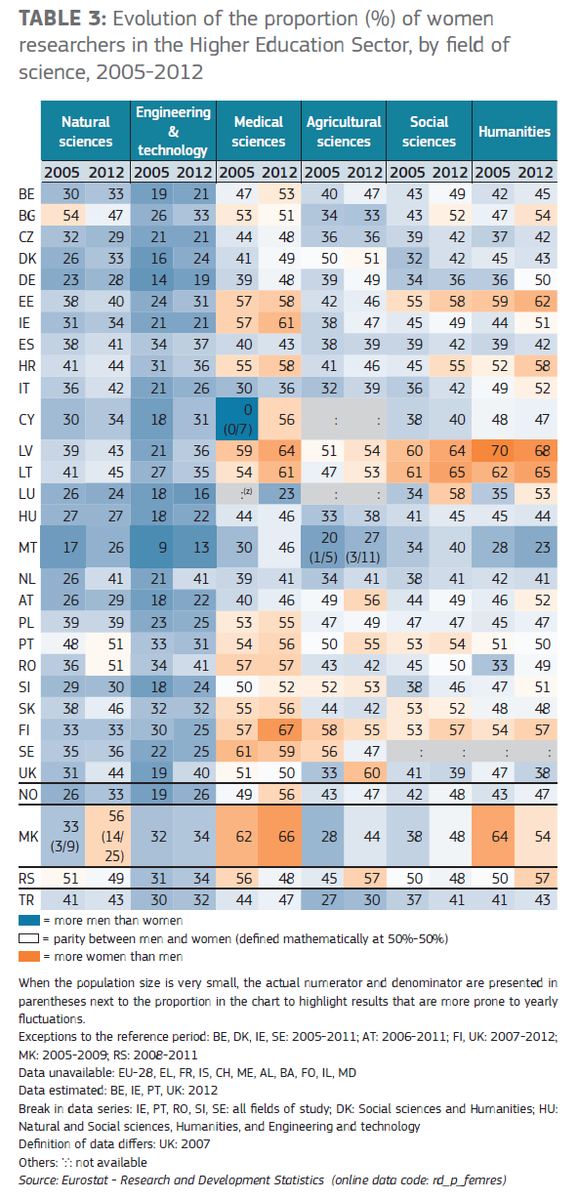
ocusing on the new data for researchers more specifically (Chapter 4), it turns out that women accounted for only 33% of researchers in 2012 (EU-28) and that figure has not noticeably changed since 2009 (EU-27). In only eight of the Member States the proportion of women surpassed the 40% mark of researchers: Latvia (53%), Lithuania (52%), Bulgaria (49%), Croatia (48%), Portugal (45%), Romania (45%), Estonia (44%) and Slovakia (42%). Besides, the presence of women researchers is stronger in the higher education (41% in 2012) and government (41.6%) sectors, while it is weaker in the business enterprises (19.7%). In addition, there is a generational effect in the higher education and the government sectors, whereby women researchers –compared to men– are more concentrated in the youngest age groups, but the opposite is observed in the oldest age groups. When looking at the fields of science in 2012, there is also a differential pattern in the gender specialization: women researchers were, in most countries, more concentrated in the social and medical sciences. However, between 2005 and 2012 the presence of women researchers in ‘non-traditional’ fields –natural sciences, engineering and technology– increased in the higher education sectors of most European countries (as Table 3 from the Preliminary Results of She Figures 2015 leaflet shows).
In relation to the working conditions in the higher education sector (Chapter 5) it should be noted that, in 2012, a greater proportion of women researchers than men researchers had part-time jobs (13.5% versus 8.5%) or ‘precarious contractual arrangements’ (10.8% versus 7.3%). However, the gender gap in part-time employment rates is far lower in this sector than in the economy as a whole. Additionally, a gender pay gap (in favour of men) also exists: in 2010, women’s average gross hourly earnings were 17.9% lower in scientific R&D, compared to 16.6% of difference in the whole economy (EU-28).
With data from the European Research Area (ERA) Survey, the report analyzes the actions that research organisations can –and already do– take for the development of working environments which support gender equality. According to the ERA Survey of 2014, around 36% of Research Performing Organisations (RPOs) indicated that they had introduced gender equality plans in 2013. In 26 out of the 37 countries for which data are presented, more than half of the responding RPOs had work‑life balance measures in place. On the other hand, targets for recruitment committees and support schemes for leadership were relatively unusual (in most countries, less than a quarter of RPOs had these measures in place in 2013). It should be noted, however, that the ERA Facts and Figures report concerns only Research Performing Organisations included in the sample of the ERA survey 2014, which employed no more than 515,000 researchers (around 20% of total EU researchers).
In terms of career advancement (Figure 6.1 from Chapter 6), in 2013, women made up only 21% of the top-level researchers (grade A), showing a slow progress compared to 2007 (18%). The resulting gender difference at that grade A level reached 58 percentage points. At the lower levels the gaps between men and women are progressively smaller and smaller, being 26 pp at grade B and 10 pp. This pattern evolves to a point where the gender distribution even changes it sign: more women than men among students and graduates in Bachelors or equivalent educational levels. This kind of effect is well-known as the “gender scissors diagram” (some references here, here and here); it looks like the European countries are closing those scissors little by little.

Besides, the participation of women in academic decision-making (as heads of higher education institutions) rose to 20.1% in 2014 (EU-28) from 15.5% in 2010 (EU-27). Despite having made some progress, women continue to be severely under-represented in top-level positions: 28% of scientific and administrative board members, and only 22% of board leaders.
Patterns in terms of their research & innovation outputs (Chapter 7) show that men in the EU tend to have greater success in funding applications in national programmes: in 2013 success rate was 31.8% for men and 27.4% for women. Regarding the corresponding author role in scientific publications or to apply for patents, women are also less likely than men to hold it. Between 2010 and 2013, just 8.9% of patent applications in the EU-28 registered a woman as the inventor. However, as corresponding authors, women and men publish their results in journals of equivalent prestige and participate with similar frequency in international scientific co‑publications (i.e. papers published by authors from at least two countries located within the EU and/or beyond).
These findings indicate that the European countries have taken some steps towards gender equality in research and innovation areas, but there is still much room for improvement.
Add new comment